
Overview of Bitcoin’s Bearish Trend: Why the Market Is Pulling Back and What Comes Next
Over the last few weeks, Bitcoin has entered a clear bearish phase, with multiple technical setups triggering downside targets across nearly every timeframe. Many traders are asking the same questions:
-
Is Bitcoin entering a deeper correction?
-
How much lower can price go?
-
Are we near a bounce—or just getting started?
-
Has the cycle topped?
This detailed breakdown explains the full picture:
the bearish signals, the multi-timeframe setups, upcoming downside targets, why a bounce is still likely, and the key levels Bitcoin needs to hold.
Let’s dive in.
New Bitcoin Targets Revealed!
📉 Daily Price Action Shows Weakness—but Tradable Patterns Remain
Bitcoin’s recent behavior is part of a statistically measurable pattern.
Monday Price Performance Stats
Since the 2023 bull market began:
-
54% of Mondays have closed green
-
Average Monday gain: +2.34%
-
Average Monday loss: –1.89%
This creates short-term scalpable setups:
✔ Upside interest zone: ~$96,000
✔ Downside interest zone: ~$92,500
These Monday statistics don’t produce “home run” trades—but they often produce high-probability scalps when price first touches major levels.
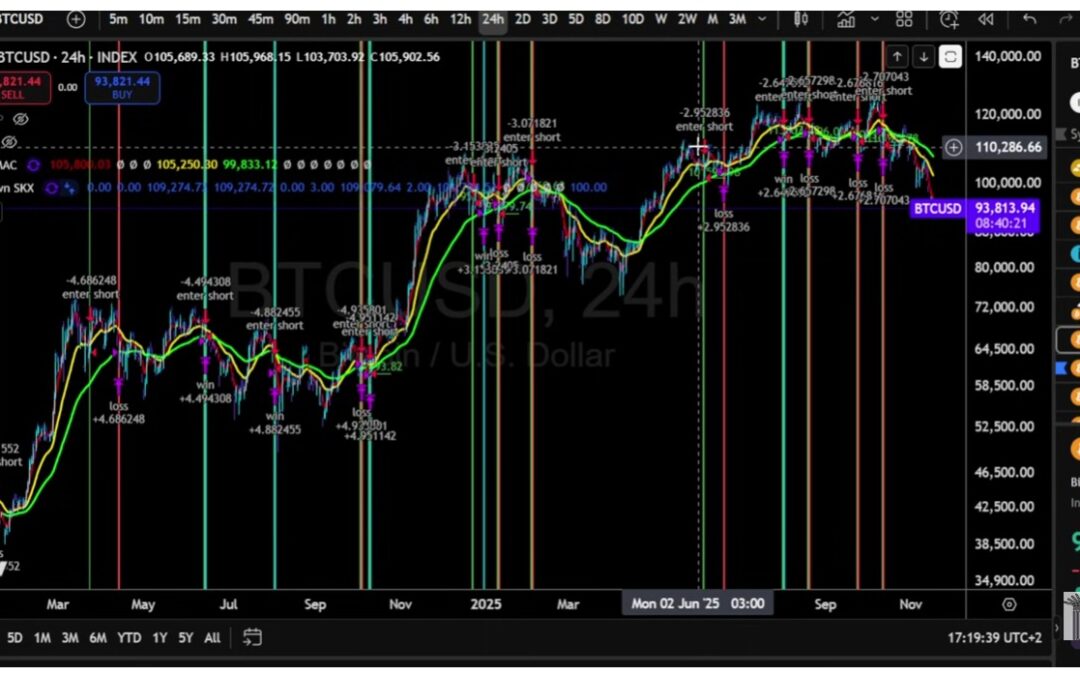
🔻 A Multi-Timeframe Bearish Setup Is Driving This Correction
The main driver of the current downturn is a recurring technical pattern involving two EMAs:
-
4-period EMA (red)
-
21-period EMA (yellow)
Whenever the 4 EMA crosses below the 21 EMA, Bitcoin historically moves to the:
👉 55 EMA (green) as a corrective target.
This setup triggered:
-
On the 12-hour
-
On the daily
-
On the 2-day
-
On the 3-day
-
And most recently, the 5-day
Every single one has hit its downside objective.
This isn’t a trading strategy—it’s directional bias, not a mechanical system.
But its consistency across many timeframes builds a strong bearish narrative.
📉 Higher-Timeframe Charts Point to Lower Targets (8-Day, 10-Day, 12-Day)
Once we move beyond the 5-day chart, reliability decreases—but the signals still matter.
8-Day Timeframe
The 4/21 EMA cross is about to trigger again.
Target:
➡ $88,500 on CME
This level has never failed historically on CME’s limited data—but again, fewer data points means less statistical confidence.
10-Day Timeframe
The next target sits around:
➡ $91,500
This zone is significant because it aligns with:
-
A major CME gap from April
-
A long-standing inefficiency in price
-
The 377 EMA support
Expect a bounce reaction here, even inside a downtrend.
📉 The 12-Day Chart Points Even Lower ($83K–$85K)
The 12-day timeframe has one of the strongest long-term records:
✔ Nearly every 4/21 EMA cross has eventually hit the 55 EMA
✔ Target sits at $83,000–$85,000
✔ This target activates only if Bitcoin closes the week below $98,200
If Bitcoin closes:
-
Above $98,200 → the deeper targets weaken
-
Below $98,200 → the deeper targets strengthen
This weekly close is critical.
📈 Are We Due for a Bounce? Yes—Conditions Are Building
Despite the bearish trend, Bitcoin is setting up for a relief bounce.
Why?
Because of the HPDR (Historical Price Distribution Range) and volatility metrics:
✔ Bitcoin is extremely stretched below its median return
✔ Volatility (BBWP) is extremely high
✔ When volatility peaks and then contracts → price snaps back toward the median
This pattern called the October bounce at $100K and several other moves this cycle.
But: volatility has not started contracting yet.
Do not front-run the bounce.
Once BBWP turns down → high probability of a move back to:
➡ $98K–$101K (retest zone)
Until then, downside continuation is still on the table.
🔎 Bullish Divergence May Be Forming—But It’s Weak
The daily chart could print bullish divergence if:
-
Price makes a lower low
-
RSI makes a higher low
This would support a bounce, but not a full reversal.
Bounce target:
➡ $98,000
→ Maybe $100,000 in an optimistic scenario
Reversal target:
❌ Not in play yet
📉 Stochastic Momentum Remains Bearish
The daily stochastic is deep in the bearish control zone.
It will stay bearish until Bitcoin closes above:
➡ $100,000
Momentum can’t stay pinned down forever—but while it sits here:
👉 Downside is still the dominant trend.
📉 The Trend Is Bearish on Every Timeframe Except the Monthly
This is the most important macro point:
-
12h → down
-
Daily → down
-
3-day → down
-
5-day → down
-
Weekly → down
-
Monthly → still up
The monthly is the last bullish timeframe.
If that flips, the argument for a cycle top gains real weight.
📉 Has the Bitcoin Cycle Topped? It’s Not a Crazy View
The analyst in the transcript admits something important:
“If you think the cycle is over, you’re not out of line.”
This isn’t 2024 anymore.
Many of the classic top signals are here:
-
High-timeframe EMA crosses
-
Bearish divergences
-
Exhaustion signals
-
Failed breakout structure
-
Loss of key moving averages
This is the first time he’s openly acknowledging the possibility that:
👉 The cycle top may be in.
That said, the monthly close will decide it.
💡 Take Profits — Don’t Be Greedy
If you bought Bitcoin at:
-
$20K
-
$25K
-
$30K
-
$40K
You are sitting on life-changing gains.
Whether the bull is over or not:
✔ Taking partial profits is wise
✔ You can always buy back later
✔ You never go broke locking in gains
✔ You reduce emotional pressure
Greed destroys portfolios.
⚠️ A Final Warning About Scams
The transcript ends with a story about a scam involving a hijacked Discord link that drained user wallets.
The key takeaway:
💥 Never click a link in a Discord announcement unless you verify it from multiple official sources.
💥 If it sounds urgent, limited, or time-sensitive — assume it’s a scam.
Scammers prey on FOMO.
Always protect your assets.
🎯 Final Thoughts — A Bearish Trend With a Bounce Ahead
Here is the most accurate summary of Bitcoin’s situation:
-
Trend: Bearish
-
Momentum: Bearish
-
High-timeframe setups: Bearish
-
Bounce probability: High
-
Reversal probability: Low (for now)
-
Key weekly level: $98,200
-
Key bounce target: $98K–$101K
-
Key downside targets:
-
$91.5K
-
$88.5K
-
$83K–$85K
-
Nothing about this is guaranteed.
But based on current signals, the most likely path is:
📉 More downside →
📈 Relief bounce →
📉 Potential deeper correction →
📈 Macro trend reassessment
Trade safely. Manage risk. Take profits.
And never let emotion drive your decisions.

Crypto Rich ($RICH) CA: GfTtq35nXTBkKLrt1o6JtrN5gxxtzCeNqQpAFG7JiBq2
CryptoRich.io is a hub for bold crypto insights, high-conviction altcoin picks, and market-defying trading strategies – built for traders who don’t just ride the wave, but create it. It’s where meme culture meets smart money.